


 13 / 92

PENÍNSULA IBÉRICA
THE IBERIAN PENINSULA
[13]
Índice Contenido IndexPopulação
Población
Population
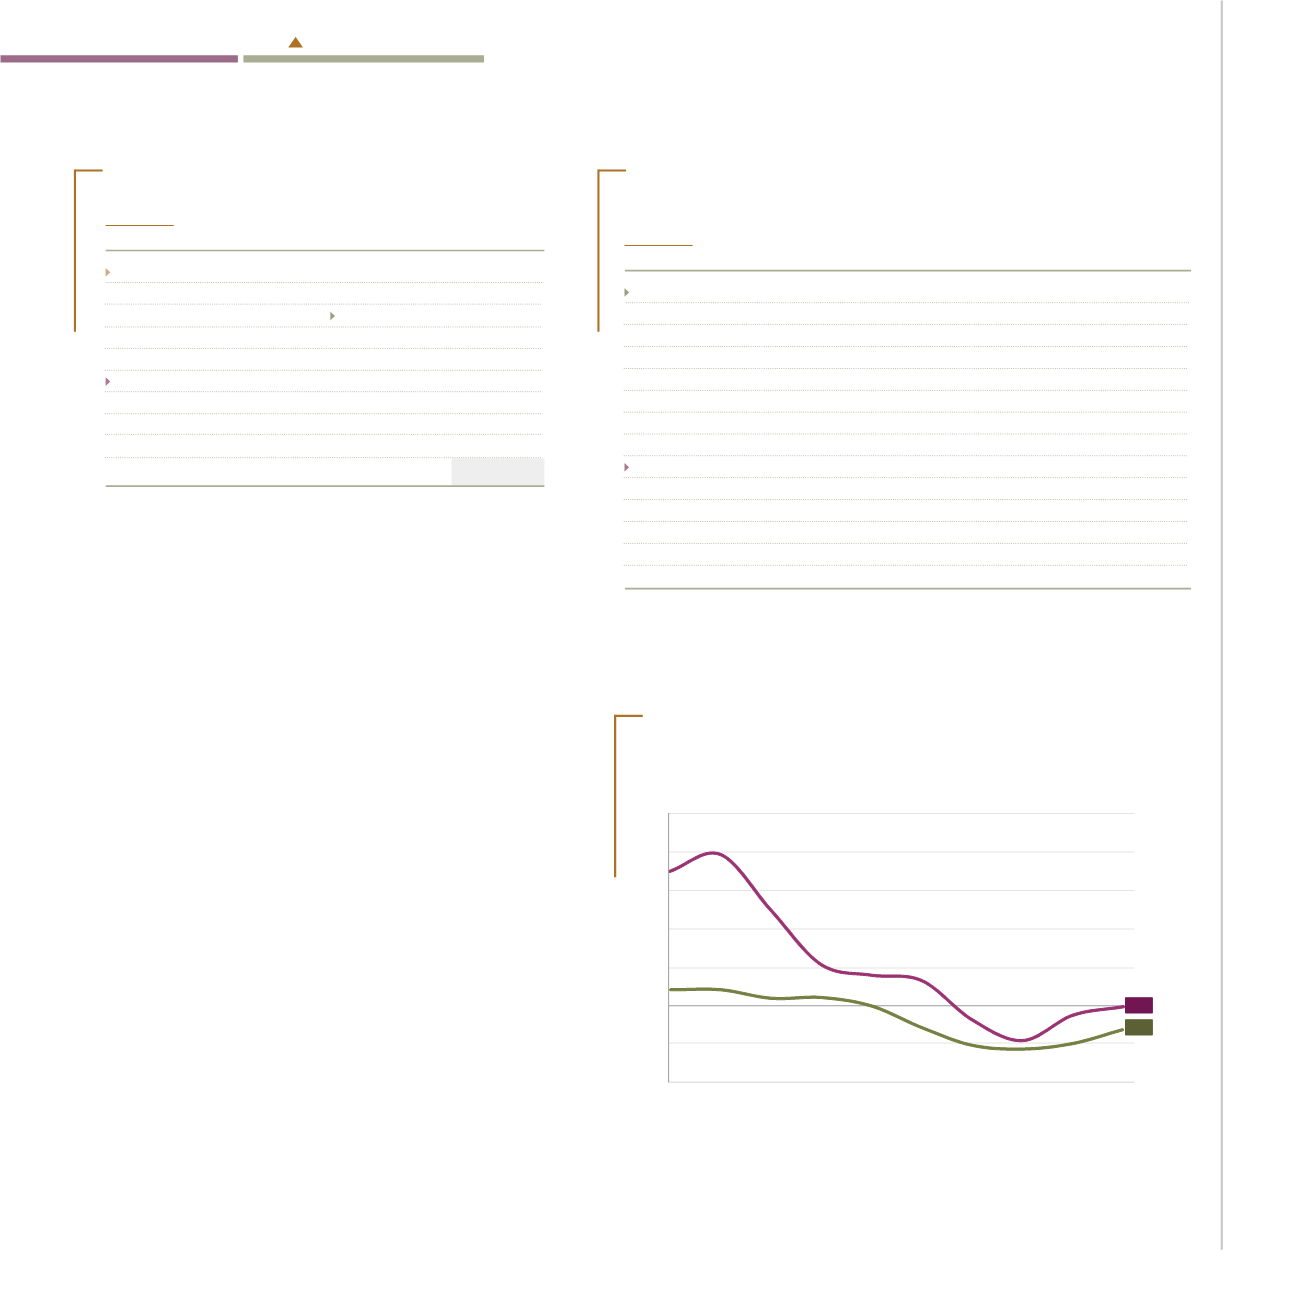
CRESCIMENTO
De 2006 a 2015, as taxas de crescimento da população
em Espanha registaram grandes alterações: 17,4%
no início deste período e -0,2% no final, com um pico
de valores negativos em 2013 (-4,6%). Em Portugal, a
oscilação foi menor, mas desde 2010 as taxas foram
sempre negativas e, no final do período, o valor registado
foi -3,2%.
CRECIMIENTO
De 2006 a 2015, las tasas de crecimiento de la población
en España registraron grandes cambios: 17,4%, en el
inicio del periodo, a -0,2%, al final, con un máximo
de valores negativos en 2013 (-4,6%). En Portugal,
la oscilación fue menor, pero desde 2010 las tasas
fueron siempre negativas y, al final del periodo, el valor
registrado fue de -3,2%.
GROWTH
From 2006 to 2015, the population growth rates in Spain
have changed significantly: 17.4% at the beginning of this
period and -0.2% at the end, with a peak of declining values
in 2013 (-4.6%). In Portugal, there were less sharp changes,
but since 2010 the rates were always negative and, at the
end of the period, the value recorded was -3.2%.
População por NUTS II, 1 de janeiro de 2015
Población por NUTS II, 1 enero 2015
Population on 1 January 2015 (NUTS II)
Taxa de crescimento efetivo, 2006-2015
Crecimiento de la población, 2006-2015
Crude rate of population change, 2006-2015
Fonte
Fuente
Source:
Eurostat
1
Dados provisórios para 2015
Datos provisionales para 2015
2015: Provisional
2
Dados estimados para 2014 e 2015
Datos estimados para 2014 y 2015
2014 and 2015: Estimated
População, 1 de janeiro de 2015
Población, 1 enero 2015
Population on 1 January 2015
508 451
(b)(e)(p)
81 198
66 415
(b)(p)
64 875
(e)
60 796
46 450
38 006
19 871
(e)
16 901
11 258
10 858
10 538
10 375
9 856
9 747
8 576
7 202
5 660
5 472
5 421
4 629
(p)
4 225
2 921
2 063
1 986
1 313
847
563
429
UE/
EU
28
DE
FR
UK
IT
ES
PL
RO
NL
BE
EL
CZ
PT
HU
SE
AT
BG
DK
FI
SK
IE
HR
LT
SI
LV
EE
CY
LU
MT
Fonte
Fuente
Source:
Eurostat
(b)
Quebra de série
Ruptura de serie
Break in time series
(e)
Dado estimado
Dato estimado
Estimated
(p)
Dado provisório
Dato provisional
Provisional
1 000 hab.
/1 000 inhab.
2015
10 375
3 622
2 809
2 264
733
441
259
246
46 450
8 400
7 397
6 385
4 940
2 735
2 478
2 165
2 126
2 063
1 464
1 326
1 125
1 092
1 050
636
585
314
85
85
Portugal
Norte
Área Metropolitana de Lisboa
Centro
Alentejo
Algarve
Região Autónoma da Madeira
Região Autónoma dos Açores
España
Andalucía
Cataluña
Comunidad de Madrid
Comunitat Valenciana
Galicia
Castilla y León
País Vasco
Canarias
Castilla- La Mancha
Región de Murcia
Aragón
Illes Balears
Extremadura
Principado de Asturias
Comunidad Foral de Navarra
Cantabria
La Rioja
Ceuta
Melilla
Fonte
Fuente
Source:
Eurostat
1 000 hab.
/1 000 inhab.
2015
2006
-3,2
-0,2
-10
-5
0
5
10
15
20
25
1
España
2
Portugal
2013
2012
2011
2010
2009
2008
2007
2014
2015
% por 1 000 hab. /
% per 1000 inhab.