INEbase / Labour market / Economically Active Population Survey / Repercussion of the EAPS-2002 methodological changes
|
|
Methodological novelties Reweighting The representation of the sample The EAPS is a survey directed to households and by nature confronts difficulties interviewing certain households, especially all those formed by just one persons or by couples in which both members work, as it is more difficult to count on them. Despite measures being taken to correct this problem (repeated visits by interviewers and telephone calls) the survey tends to over represent the older population, since this is the easiest population to interview. What does reweighting consist of? So that the survey well reflects the weight that each age group has on the population a technical improvement known as reweighting of the elevation factors is introduced. This is a mathematical process by means of which the elevation factors are readjusted in such a way that: 1.- The results that the survey supplies on the population by sex and age group in each Autonomous Community coincide with real population figures.
2.- The results that the survey supplies on the population of 16 and over by provinces, coincide with real figures. By means of this process the population figures that the survey offer coincide with the real figures. Why reweighting now specifically? To be able to apply the reweighting of the sample elevation factors it is necessary to have a external population variable available for the survey which is sufficiently reliable and periodic to be used quarterly. Before it was only possible to update the population projections information every 10 years based on the population censuses. Now, thanks to the Continuous Register frequent and high quality population figures are available that moreover, have been incorporated into the process thanks to a recent mathematical model.. The reweighting of the elevation factors from the design of the survey is found in article 3.5 of Regulation 577/98 of the Council of the European Union.
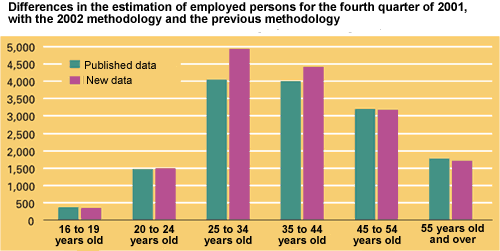
The effect of reweighting By conducting the EAPS interviews during the fourth quarter of 2001 the following distribution of the population of 16 and over was obtained from the survey: Young persons from 16 to 19 years represent 6.1 per cent, 20 to 24, 9.2 per cent, the central group of 25 to 54 years 49.3 per cent and 55 and over, 35.1 per cent. The demographic information available shows that in reality some of these percentages are significantly different. The percentage of young persons from 16 to 19 is the same (6.1) and very similar to persons of 20 to 24, which is 9.4%; but the central group of 25 to 54 years means 52.7 per cent and the percentage of persons of 55 and over is reduced to 31.7. The reweighting specifically grants interviewees from each age group their authentic weight or representativity in the whole population. The chart shows the figures prior and subsequent to the application of the reweighting process.
As a consequence of the reweighting other results relevant to the survey are also modified. In particular the employed figure increases as, as is known, there is a greater proportion of employed persons in the central age group of 25-54.
|
|||||||||||||||||||||||||||||||||||||||||||||||||||||||||||||||||||||||||||||||||||||||||||||||||||||
 Technical document